Welcome to MODEL Software Oil And Gas Monitor
Oil And Gas Monitor: Monitor Noise Particles, and Volatile Organic Compounds (VOCs).
- Home - MODEL Software Home page.
- Main - Oil and Gas Monitor Home page (this page).
This web site is independent of the driller, producer and Broomfield County.
You are welcome to copy anything.
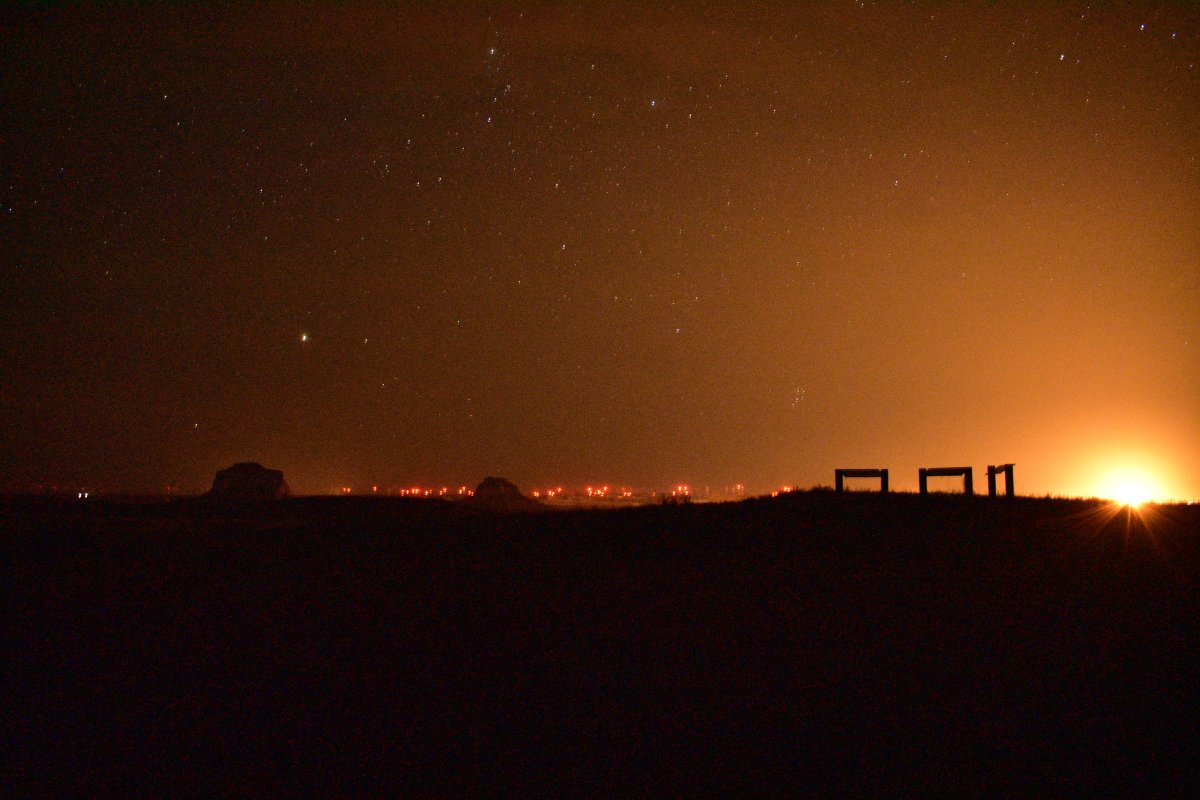
Pawnee Grasslands At Midnite -- Credit and permission: James W Cole
Link: https://www.modelsw.com/OilGasMonitor/PawneeGrasslandsAtMidnite.jpg
Fullsize: https://www.modelsw.com/OilGasMonitor/PawneeGrasslandsAtMidniteFull.jpg
One is hard pressed to see the stars because of all the flares from the oil and gas drilling that light up the night.
- Define - Used to define the development and location of an independent "Citizen" monitor.
- Map - Real-time Google map.
This is independent real-time monitoring of VOCs, particles, and sound levels.
The intent is to keep the driller and producer honest in their committment to low noise, particles, and VOCs.
The data (defined above) is sent to a server each minute and displayed along with other monitors on Google Maps.
The markers shown on the maps display I (information), W (warning), or A (alarm) and are updated with each refresh of the map.
When clicked they display the last known data for the monitor inputs.
A plot button displays the last 24 hours for the monitor selected.
- Data
The easiest way to get monitor data is click on the map.
Then click on a location. Then click on plot.
It offers a link at the top of the page: Download to monitor.csv file.
Click on the link.
The default data is the last 24 hours.
You can change the Start and End dates YYYY-MM-DD HH:MM.
Then click the Submit button.
It builds a file monitorxx.csv (where xx is the location you clicked).
click the link: CLICK TO DOWNLOAD monitorxx.csv.
Look for the file in your download folder.
You can load the csv file in Excel and build other plots.
Or duplicate the plots that exist on the Plot page with more detail.
Examples are shown in the data page.
- Map Auto Refresh - Real-time Google map.
This is the same map as above but set to Auto Refresh -- Requires Cookies and may not work for you
Scroll (DON'T Drag) the map down to view four imputs:
1) Refresh check box; 2) a text box for Minutes between refresh;
3) a Warning check box; and 4) Alarm check box;
When refresh is checked, it updates the map at the Minutes rate entered in minutes box.
When Warning is checked, if any last known value was Information and the current value is Warning a beep will sound.
When Alarm is checked, if any last known value was Information or Warning and the current value is Alarm a double beep will sound.
If Warning and Alarm are not checked, the markers will still change to the new values but will do so silently.
These Options (stored in Cookies) will change to their defaults of false and 60 minutes after one month or if you have disabled cookies.
When they time out, you will need to reset them.
- Freeform Query - for analysis of the tables and data.
This allows you to analyze or modify the data. (Use MySQL valid queries.)
- Tables - Underlying Tables Supporting the Oil and Gas Database.
- Load Monitor - Updates Monitor.
Notes:

